Reports and articles
Levelling-up or evening out? How sector dynamics explain regional productivity gaps
Published on April 17th 2023
In the last two decades, the UK has experienced weaker productivity growth than other major developed and developing economies, a phenomenon known as the ‘productivity puzzle’. Worldwide, productivity growth has slowed since the global financial crisis of 2008, but as we discussed in our Cambridge Industrial Innovation Policy report Understanding sectoral sources of aggregate productivity growth: a cross-country analysis, the UK was one of the economies hit the hardest during the crisis, and it has since struggled to recover its dynamism.
In February 2022, the Government published its Levelling Up White Paper, framed as a ‘plan to transform the UK by spreading opportunity and prosperity to all parts of it’. The paper presents an ambitious, decade-long policy agenda to change the UK’s economic geography and narrow the country’s regional inequality.
With the aim to inform policy developments in this area, in this article, we draw upon the findings from the 2023 edition of the UK Innovation Report, to examine how sector dynamics contribute to closing or widening productivity gaps across the UK.
We find that over the past twenty years, productivity growth in manufacturing and information and communication services has had an equalising effect across the UK regions and countries. However, this trend stands in contrast to the expansion of professional, scientific, and technical activities, which has led to a widening productivity gap. The shrinkage of manufacturing has also contributed to this gap. Taken together, these sector dynamics have amplified regional disparities in labour productivity.
How does productivity vary across UK regions and countries?
Regional disparities in productivity are a longstanding problem. In 2019, London and the South East of England were the UK regions with the highest labour productivity levels, showing annual values of £80,034 and £59,709 per job. In contrast, Wales, the North East of England, and Yorkshire and The Humber showed among the lowest productivity levels, around £47,000 in 2019.
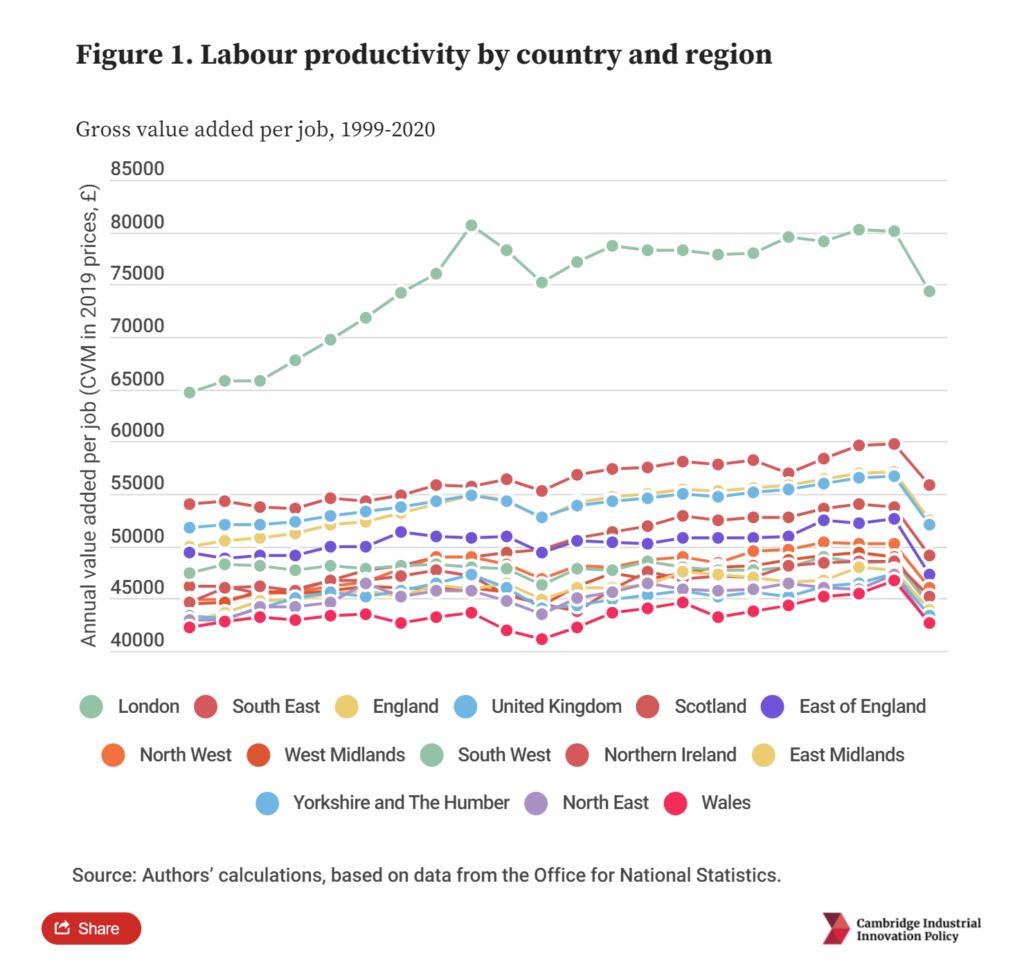
Sluggish productivity growth is pervasive across the UK. However, regions and countries such as London and Scotland stand out for their relatively faster growth, with rates of 1% and 0.8% between 1999 and 2019. Scotland also fared better during the financial crisis of 2008/09. Different from the rest of the UK, it did not experience a fall in productivity levels in 2008/09. In comparison, the South West and the East of England experienced among the slowest rates, 0.2% and 0.4%, below the UK average of 0.5% in 1999 ̶ 2019.
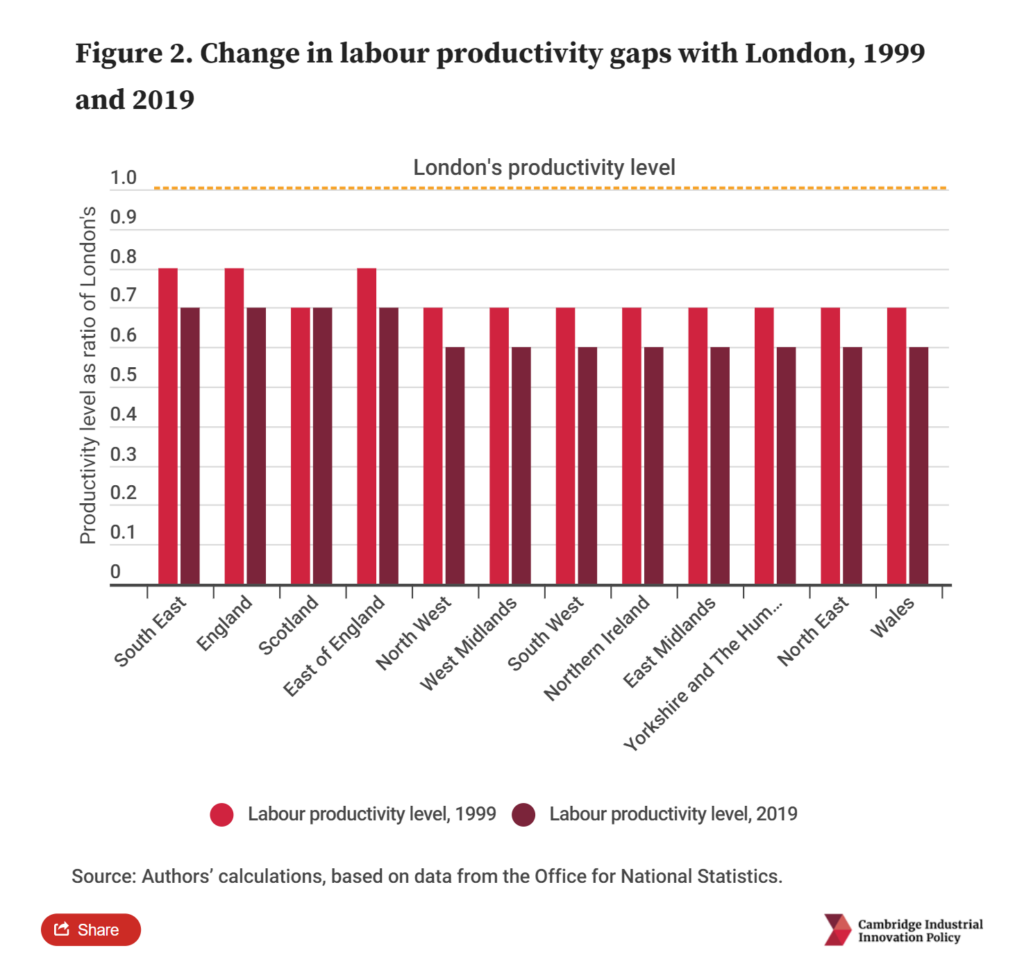
Faster growth experienced in London has meant that productivity gaps between the capital and the rest of the UK have widened. Although Wales shows the lowest productivity levels, 58% of that of London, it is in the South West and the East of England where productivity gaps have amplified the most, 13 and 11 percentage points, respectively, between 1999 and 2019.
Closing the gap: the equalising impact of the manufacturing and information and communication sectors
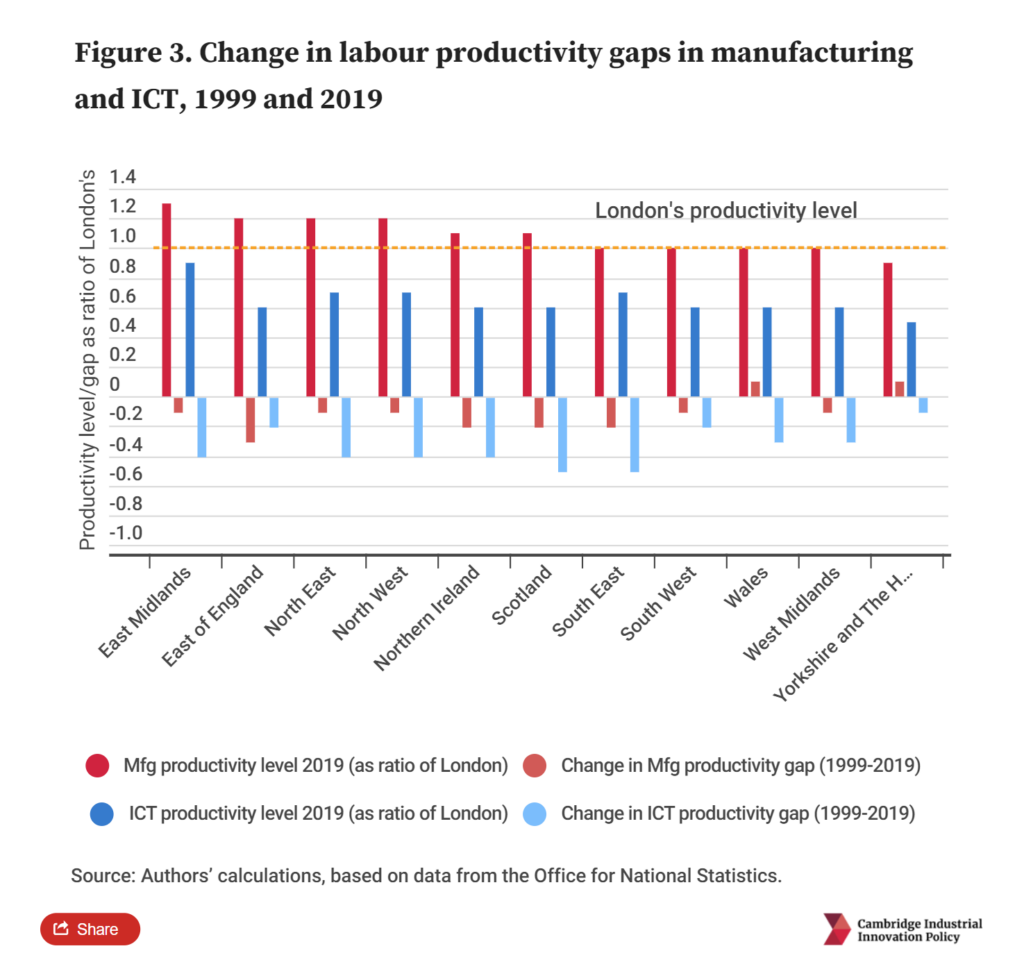
Our analysis shows that the manufacturing and information and communication (ICT) sectors are crucial in closing productivity gaps across the UK. These sectors have high productivity levels and fast productivity growth, which exceeded the UK average of 0.5% between 1999 and 2019.
Manufacturing and ICT also have equalising characteristics. Manufacturing productivity is higher or very close to London’s productivity levels across the UK. Manufacturing participation in regional economies also tends to be higher outside of London. While manufacturing only accounted for 9.3% of the UK value added in 2019, and 2% in London, it is much more prominent in Wales (16.9%) and the East Midlands (16.8%).
Although ICT shows higher productivity levels in London than in the rest of the UK and activities are highly concentrated in the capital city, the gap between London and the rest of the UK has narrowed in the last two decades. This trend is explained because between 1999 and 2019, ICT productivity grew faster in the rest of the UK than in London.
Evening-out: deindustrialisation and the expansion of low-productivity professional services
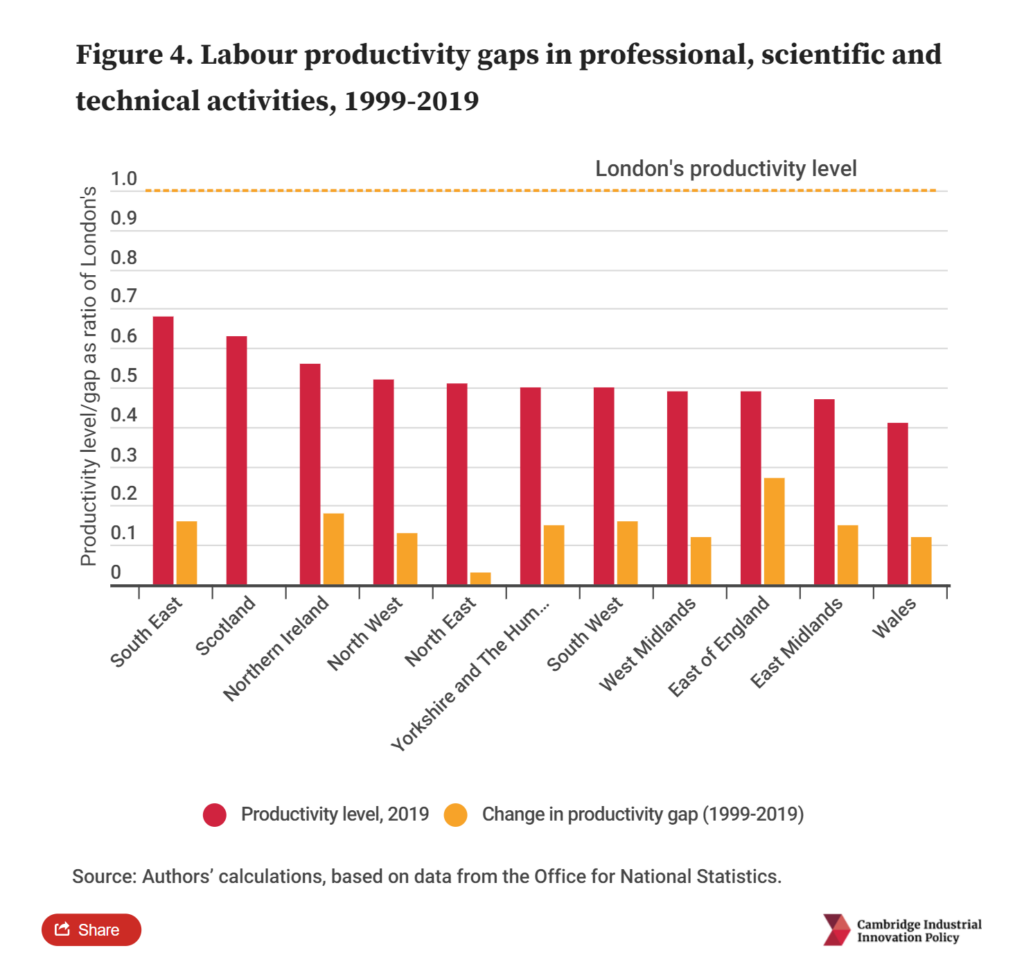
We found that the expansion of professional, scientific and technical activities and the shrinkage of manufacturing has contributed to widening regional productivity gaps.
Between 1999 and 2019, employment in professional, scientific and technical activities experienced an expansion of between 1.4 percentage points in the North East of England and 3.8 percentage points in the East of England. However, this sector shows among the largest productivity disparities and, with the exception of Scotland, productivity gaps with London have widened in the past two decades.
We mentioned earlier how manufacturing productivity has a regional equalising effect. However, a substantial reduction in manufacturing employment in the last two decades has also negatively impacted this convergence.
To understand how sectors influence labour productivity performance, we decomposed productivity growth rates into two sub-components: (i) an intra-industry growth effect, which captures the productivity growth of each industrial sector and its relative weight in the overall economy; and (ii) an allocation effect, which captures changes in the relative size of sectors over time.
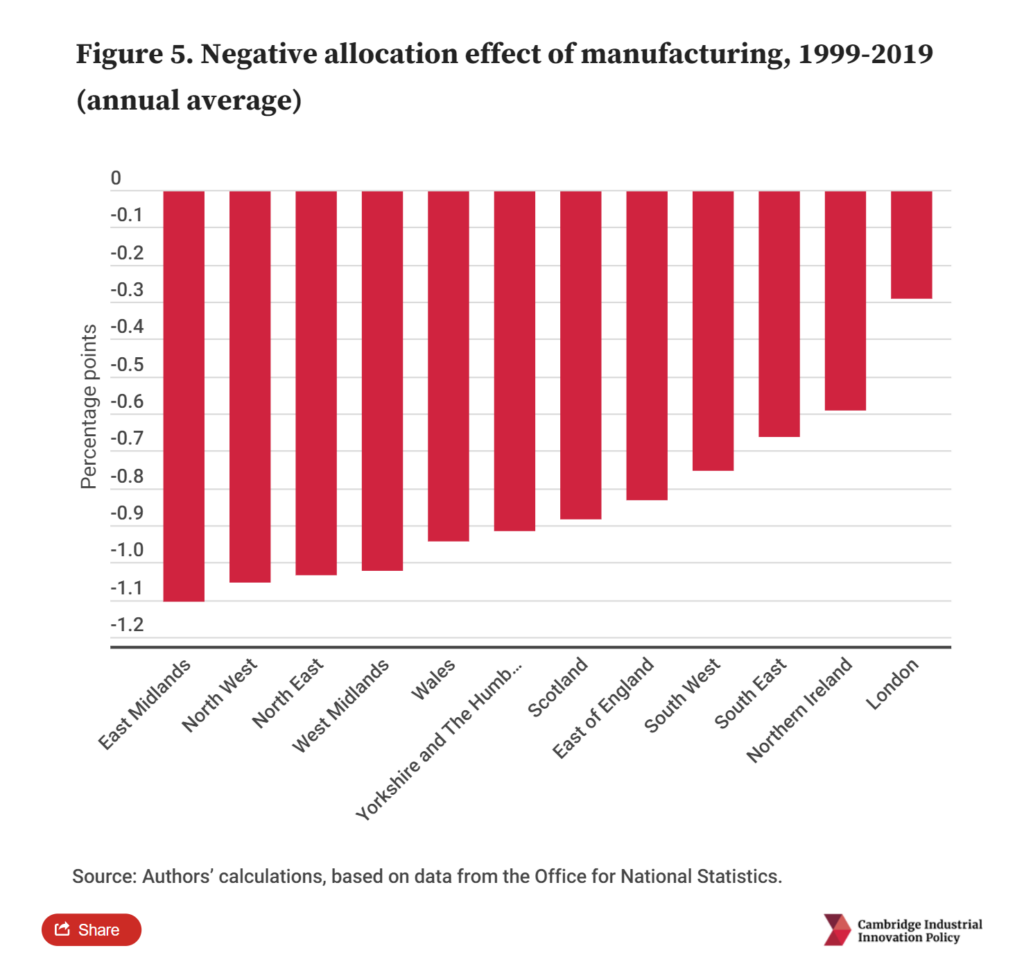
Between 1999 and 2019, the UK countries and regions experienced negative allocation effects. In other words, shifts in the size of sectors had a negative effect on overall labour productivity growth and this was mainly influenced by the reduction in manufacturing employment.
The most negative impacts from the shrinkage of manufacturing are observed in East Midlands, North West, North East and West Midlands, where the decline of manufacturing has costed these regions a percentage point on average per year between 1999 and 2019.
What does this mean for the levelling up agenda?
As previously highlighted in our report Understanding sectoral sources of aggregate productivity growth: a cross-country analysis, an effective policy to boost productivity growth needs to be grounded in a sound understanding of industry-specific characteristics, trends, competition dynamics, and the interdependencies across industries.
Productivity cannot grow at the same pace across all sectors. Tradable sectors, such as information and communication and manufacturing, are more likely to experience faster productivity growth. These sectors also show lower disparities in productivity which makes them drivers of levelling-up.
High productivity in these sectors means that they typically involve higher value-added economic activities and thus are more likely to provide well paid jobs. This, in turn, can have a positive spillover effect on other sectors and contribute to raising the overall living standards of a region. Thus, to address geographical inequalities, it is crucial to ensure that the benefits of developing high productivity sectors reach the most disadvantaged areas.
Knowledge-intensive services, such as professional, scientific and technical activities, are expanding; however, because of the wide variation in productivity levels in this sector, its expansion is amplifying productivity gaps. Closing these gaps would contribute as well to the levelling-up agenda. This may involve investing in infrastructure, developing skills in disadvantaged areas, attracting and promoting high-value-added activities in these places, and improving working conditions.
For further information please contact:
Jennifer Castañeda-Navarrete
+44(0)1223 766141jc2190@cam.ac.ukConnect on LinkedInDr Jennifer Castañeda-Navarrete is a Senior Policy Analyst at Cambridge Industrial Innovation Policy. This post draws on previous reports Understanding sectoral sources of aggregate productivity growth: a cross-country analysis and the 2023 UK Innovation Report.
Related resources
News | 6th February 2026
UK Manufacturing Dashboard: latest performance and global benchmarks
3rd February 2026
The Swiss paradox: a services reputation built on an industrial and innovation powerhouse
News | 21st January 2026


